1. Raster Gap Filling
In this tutorial we will fill no-data gaps in a series of rasters, using different functions provided by eumap.gapfiller.
First, let’s import the necessary modules.
[1]:
# To work with local eumap code
# import sys
# sys.path.append('../../')

from eumap import datasets
from eumap.misc import find_files
from eumap import raster
from eumap import gapfiller
from eumap import plotter

datasets.pilot.TILES
[1]:
['10636_switzerland',
 '14576_netherlands',
 '14580_netherlands',
 '15560_poland',
 '16057_ireland',
 '22497_sweden',
 '4582_spain',
 '5606_greece',
 '9326_italy',
 '9529_croatia']
We will use a time-series of LANDSAT raster for Sweden, downloading the raster data from Zenodo.
[2]:
tile = datasets.pilot.TILES[5]
datasets.pilot.get_data(tile+'_rasters.tar.gz')
878.13 MB downloaded, unpacking...
Download complete.
Now, let’s generate a list of file paths sorted by time, starting from the oldest raster.
[3]:
from pathlib import Path
import os

def get_fn_rasters(tile, band, perc):

    data_root = datasets.DATA_ROOT_NAME
    tile_dir = Path(os.getcwd()).joinpath(data_root, tile) # datasets.pilot.get_data() downloads to the current working directory by default

    seasons = ['winter', 'spring', 'summer', 'fall']

    fn_rasters = []
    for year in range(2000, 2020):
        for season in seasons:
            fn_rasters += find_files(dir_list=tile_dir, pattern=f'{year}/landsat*{season}*{band}*{perc}*.tif')

    print(f'Total number of files: {len(fn_rasters)}')
    print(f'- First file: {fn_rasters[0]}')
    print(f'- Last file: {fn_rasters[len(fn_rasters)-1]}')

    return fn_rasters

perc = 'p50'
band = 'nir'
# we will use the 50th percentile of the LANDSAT NIR band provided in the eumap datasets.tiles
fn_rasters = get_fn_rasters(tile, band, perc)
Total number of files: 80
- First file: /home/opengeohub/leandro/Code/eumap/docs/notebooks/eumap_data/22497_sweden/2000/landsat_ard_winter_nir_p50.tif
- Last file: /home/opengeohub/leandro/Code/eumap/docs/notebooks/eumap_data/22497_sweden/2019/landsat_ard_fall_nir_p50.tif
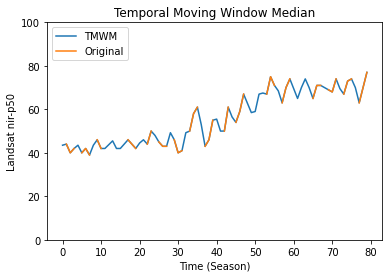
1.1. Temporal Moving Window Median (TMWM)
This method works in the temporal domain, using different combinations of temporal moving window (based in the parameter time_win_size) to calculate several median values, prioritizing them in three phases of gap filling attempts. The phase 1 uses only observations of the same season/month/day in different years, doubling the temporal moving window until find some available median value to fill the gap. If all the values of the same season/month/day are no-data, the phase 2
applies the same approach considering the average between the two neighborhood season(s)/month(s)/day(s). The phase 3 tries to fill the gap using a median value calculated with all observations available in different years. If a specific pixel has only no-data value in all the observation (a no-data time-series) the gap will remaining after all TMWM attempts:

[4]:
tmwm = gapfiller.TMWM(fn_files=fn_rasters, season_size=4, time_win_size=9, std_env=2, outlier_remover=gapfiller.OutlierRemover.Std)
data_tmwm = tmwm.run()
fn_rasters_tmwm = tmwm.save_rasters('./gapfilled_tmwm', dtype='uint8', save_flag=True)
[12:13:31] Reading 80 raster files using 4 workers
[12:13:35] There are 29925745 gaps in (1000, 1000, 80)
[12:13:35] Removing temporal outliers using OutlierRemover.Std
[12:16:50] 5951043 outliers removed
[12:16:50] There are 35876788 gaps in (1000, 1000, 80)
[12:16:50] Data (1000, 1000, 20) organized in time=0
[12:16:51] Data (1000, 1000, 20) organized in time=1
[12:16:51] Data (1000, 1000, 20) organized in time=2
[12:16:51] Data (1000, 1000, 20) organized in time=3
[12:16:51] Calculating 152 gap filling possibilities
[12:16:51] Using cpu engine
[12:16:52] Possibilities calculated
[12:17:01] 100.00% of the gaps filled in 205.99 segs
[12:17:01] Remained gaps: 744
[12:17:06] Number of files saved in gapfilled_tmwm: 160
You can check that all the gaps were filled and 160 raster files were saved, 80 files with the gapfilled time series data and 80 files containing the size of the temporal moving window used to fill the gap.
Let’s plot the result for a specific pixels:
[5]:
import matplotlib.pyplot as plt

# pixel position in the numpy array
x, y = 50, 50

plt.plot(tmwm.gapfilled_data[x, y, :], label='TMWM')
plt.plot(tmwm.data[x, y, :], label='Original')

plt.title('Temporal Moving Window Median')
plt.ylabel(f'Landsat {band}-{perc}')
plt.xlabel('Time (Season)')
plt.legend(loc="upper left")
plt.ylim([0, 100])
plt.show()
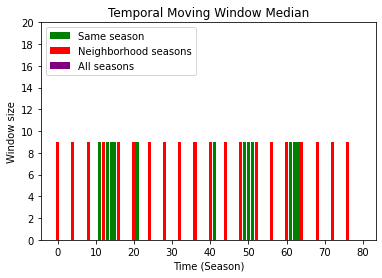
It’s possible check the the size of the moving windown used to calculated the median value:
Same season: values between 0 and n_years (ex:
pixel_value=4andwindow_size=4)Neighborhood seasons: values between n_years and n_years*2 (ex:
pixel_value=24andwindow_size=4)All seasons: values between n_years2 and n_years3 (ex:
pixel_value=44andwindow_size=4)
[6]:
import numpy as np
from matplotlib.ticker import MaxNLocator

def plt_bar(time_flag, tmwm_flag, mask_flag, color, label, rescale_factor):
    masked_tmwm_flag = np.zeros(ts_size)
    masked_tmwm_flag[mask_flag] = tmwm_flag[mask_flag] - rescale_factor
    plt.bar(time_flag, masked_tmwm_flag, color=color, label=label)

tmwm_flag = tmwm.gapfilled_data_flag[x, y, :]

ts_size = len(tmwm_flag)
season_size = 4
n_years = (ts_size / season_size)
time_flag = range(0, ts_size)

same_season_mask = (tmwm_flag < n_years)
plt_bar(time_flag, tmwm_flag, same_season_mask, 'Green', 'Same season', 0)

neib_season_mask = np.logical_and((tmwm_flag >= n_years), (tmwm_flag < n_years*2))
plt_bar(time_flag, tmwm_flag, neib_season_mask, 'Red', 'Neighborhood seasons', n_years)

all_season_mask = (tmwm_flag >= n_years*2)
plt_bar(time_flag, tmwm_flag, all_season_mask, 'Purple', 'All seasons', n_years*2)

ax = plt.gca()
ax.yaxis.set_major_locator(MaxNLocator(integer=True))

plt.title('Temporal Moving Window Median')
plt.ylabel(f'Window size')
plt.xlabel('Time (Season)')
plt.legend(loc="upper left")
plt.ylim([0, 20])
plt.show()
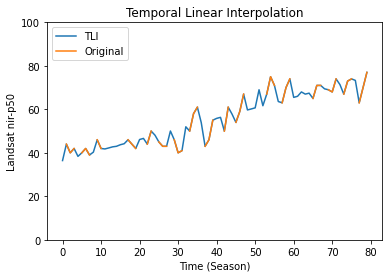
1.2. Temporal Linear Interpolation (TLI)
This method works in the temporal domain, using a linear regression (LinearRegression) over the time to interpolate the no-data values:
[7]:
tli = gapfiller.TLI(fn_files=fn_rasters)
data_tli = tli.run()
fn_rasters_tli = tli.save_rasters('./gapfilled_tli', dtype='uint8')
[12:17:07] Reading 80 raster files using 4 workers
[12:17:10] There are 29925745 gaps in (1000, 1000, 80)
[12:18:05] 100.00% of the gaps filled in 55.79 segs
[12:18:13] Number of files saved in gapfilled_tli: 160
You can check that all the gaps were filled and 160 raster files were saved, 80 files with the gapfilled time series data and 80 files containing the Root Mean Square Error of the fitted regression.
Let’s plot the result for a specific pixels:
[8]:
import matplotlib.pyplot as plt

# pixel position in the numpy array
x, y = 50, 50

plt.plot(tli.gapfilled_data[x, y, :], label='TLI')
plt.plot(tli.data[x, y, :], label='Original')

plt.title('Temporal Linear Interpolation')
plt.ylabel(f'Landsat {band}-{perc}')
plt.xlabel('Time (Season)')
plt.legend(loc="upper left")
plt.ylim([0, 100])
plt.show()
It’s also possible retrieve the RMSE for the fitted regression, which will change in the space:
[9]:
print(f'RMSE:')
print(f' -Pixels {x-1} {y-1}: {tli.gapfilled_data_flag[x-1, y-1, 0]:.3f}')
print(f' -Pixels {x} {y}: {tli.gapfilled_data_flag[x, y, 0]:.3f}')
print(f' -Pixels {x+1} {y+1}: {tli.gapfilled_data_flag[x+1, y+1, 0]:.3f}')
RMSE:
 -Pixels 49 49: 4.063
 -Pixels 50 50: 5.486
 -Pixels 51 51: 6.593
1.3. InPainting
This method works in the spatial domain, using the neighbouring pixels to fill the no-data values through a Inpainting technique implemented by OpenCV. If the you provide a data_mask argument (2D array indicating a valid areas, equal 1) only the missing values inside the mask will be gapfilled.
[10]:
import warnings; warnings.simplefilter('ignore')
inpaint = gapfiller.InPainting(fn_files=fn_rasters, space_win = 10)
data_inpaint = inpaint.run()
fn_rasters_inpaint = inpaint.save_rasters('./gapfilled_inpaint', dtype='uint8')
[12:18:13] Reading 80 raster files using 4 workers
[12:18:16] There are 29925745 gaps in (1000, 1000, 80)
[12:19:14] 23.14% of the gaps filled in 57.66 segs
[12:19:15] Remained gaps: 23000000
[12:19:21] Number of files saved in gapfilled_inpaint: 160
You can check that just 23.14% of the gaps were filled. It occurred because in some images all the pixel are no-data, not being able to find any neighboring pixels.
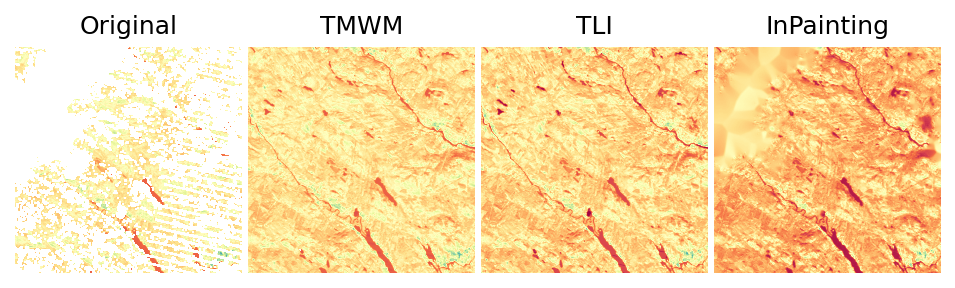
1.4. Gapfilled Raster Data
Now it’s time to compare the gapfilled data produced by the three approaches:
[11]:
i = 35
img_gaps = fn_rasters[i]
img_gapfilled_tmwm = fn_rasters_tmwm[i]
img_gapfilled_tli = fn_rasters_tli[i]
img_gapfilled_inpaint = fn_rasters_inpaint[i]

print(f'Image: {img_gaps}')
plotter.plot_rasters(
    img_gaps,
    img_gapfilled_tmwm,
    img_gapfilled_tli,
    img_gapfilled_inpaint,
    cmaps='Spectral',
    figsize=8,
    titles=['Original', 'TMWM', 'TLI', 'InPainting'],
    nodata=0
)
Image: /home/opengeohub/leandro/Code/eumap/docs/notebooks/eumap_data/22497_sweden/2008/landsat_ard_fall_nir_p50.tif
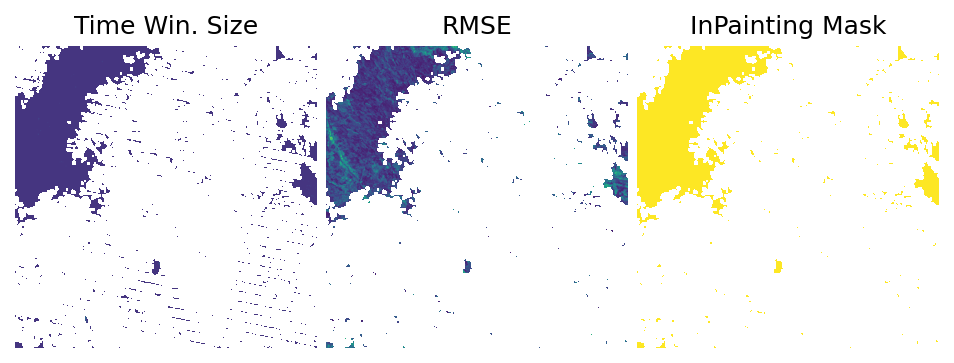
Let’s also look in the rasters containing the metadata information about the gapfilling approach:
[12]:
flag_offset = len(fn_rasters)
flag_i = flag_offset + i

img_gapfilled_tmwm_flag = fn_rasters_tmwm[flag_i]
img_gapfilled_tli_flag = fn_rasters_tli[flag_i]
img_gapfilled_inpaint_flag = fn_rasters_inpaint[flag_i]

print(f'Image: {img_gaps}')
plotter.plot_rasters(
    img_gapfilled_tmwm_flag,
    img_gapfilled_tli_flag,
    img_gapfilled_inpaint_flag,
    cmaps='viridis',
    figsize=8,
    titles=['Time Win. Size', 'RMSE', 'InPainting Mask'],
)
Image: /home/opengeohub/leandro/Code/eumap/docs/notebooks/eumap_data/22497_sweden/2008/landsat_ard_fall_nir_p50.tif
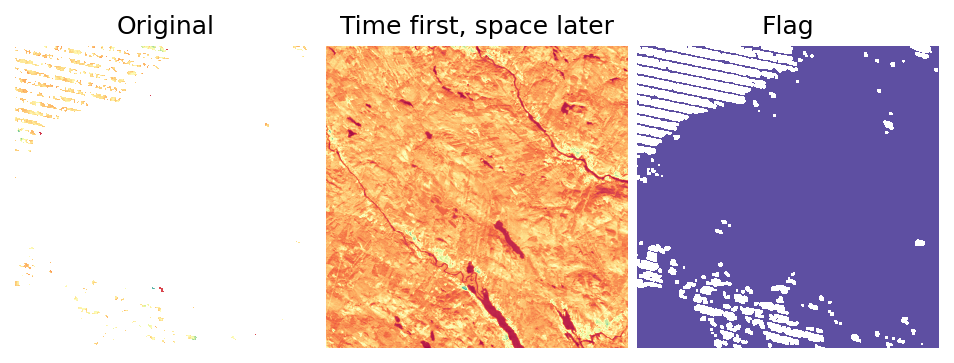
1.5. Time first, space later
It’s possible combine two or more gapfilling though the properties gapfilled_data and data. To illustrate it we will use the Switzerland tile:
[13]:
# tile = datasets.pilot.TILES[0]
#datasets.pilot.get_data(tile+'_rasters.tar.gz')
fn_rasters = get_fn_rasters(tile, 'nir', 'p50')
Total number of files: 80
- First file: /home/opengeohub/leandro/Code/eumap/docs/notebooks/eumap_data/22497_sweden/2000/landsat_ard_winter_nir_p50.tif
- Last file: /home/opengeohub/leandro/Code/eumap/docs/notebooks/eumap_data/22497_sweden/2019/landsat_ard_fall_nir_p50.tif
…and execute first the TMWM approach and later the InPainting through the helper function time_first_space_later:
[14]:
tfsl = gapfiller.time_first_space_later(
    fn_files = fn_rasters,
    time_strategy = gapfiller.TMWM,
    time_args = { 'season_size': 4 },
    space_strategy = gapfiller.InPainting,
    space_args = { 'space_win': 10 }
)

fn_rasters_tfsl  = tfsl.save_rasters('./gapfilled_tmwm_inpaint', dtype='uint8', fn_files=fn_rasters)
[12:19:23] Reading 80 raster files using 4 workers
[12:19:26] There are 29925745 gaps in (1000, 1000, 80)
[12:19:26] Data (1000, 1000, 20) organized in time=0
[12:19:26] Data (1000, 1000, 20) organized in time=1
[12:19:27] Data (1000, 1000, 20) organized in time=2
[12:19:27] Data (1000, 1000, 20) organized in time=3
[12:19:27] Calculating 152 gap filling possibilities
[12:19:27] Using cpu engine
[12:19:28] Possibilities calculated
[12:19:34] 100.00% of the gaps filled in 7.96 segs
[12:19:38] Number of files saved in gapfilled_tmwm_inpaint: 160
Now, let’s check the result:
[15]:
from eumap import plotter

i = 51
flag_offset = len(fn_rasters)
flag_i = flag_offset + i

img_gaps = fn_rasters[i]
img_gapfilled_tfsl = fn_rasters_tfsl[i]
img_gapfilled_flag_tfsl = fn_rasters_tfsl[flag_i]


print(f'Image: {img_gaps}')
plotter.plot_rasters(
    img_gaps,
    img_gapfilled_tfsl,
    img_gapfilled_flag_tfsl,
    cmaps='Spectral',
    figsize=8,
    titles=['Original', 'Time first, space later', 'Flag'],
)
Image: /home/opengeohub/leandro/Code/eumap/docs/notebooks/eumap_data/22497_sweden/2012/landsat_ard_fall_nir_p50.tif